Examples
Below is a gallery of examples of the
VSPEC variable star model


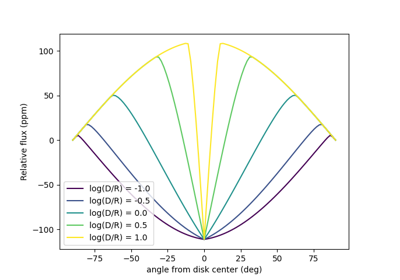
Plot the effect of facula depth on it’s lightcurve
Plot the effect of facula depth on it's lightcurve
Below is a gallery of examples of the
VSPEC variable star model
Plot the effect of facula depth on it’s lightcurve