Note
Go to the end to download the full example code.
Explore Grids
Take a look at the difference between the
RectangularGrid and SpiralGrid classes.
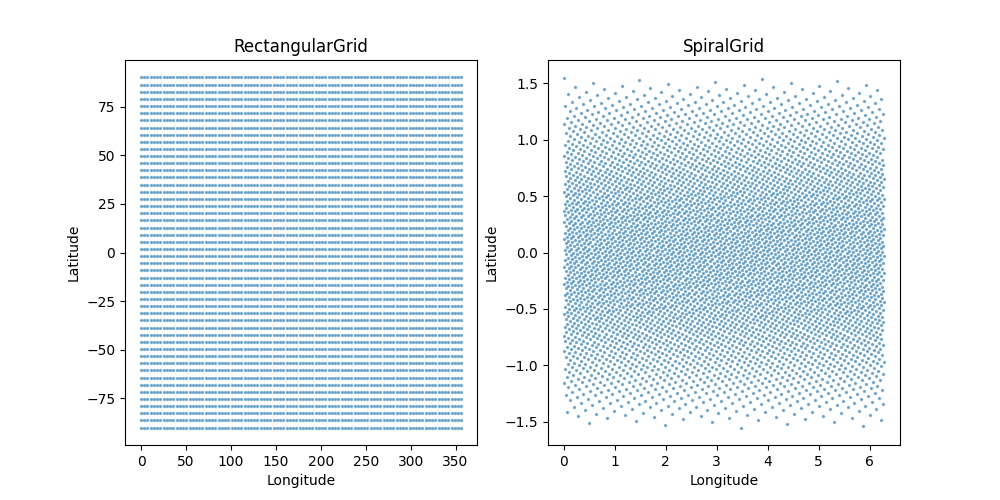
When it comes to storing the data mapping a stellar surface, the easiest way to do so is to use a rectangular grid of evenly spaced latitude and longitude points.
However, at the poles the points become smaller, and we end up with unneccesarily high resolution at the expense of computational cost.
We can solve this by using an evenly spaced distribution of points on a sphere. This is the Fibbonacci lattice or spiral.
import numpy as np
import matplotlib.pyplot as plt

from vspec_vsm.coordinate_grid import RectangularGrid, SpiralGrid
Set up the grid
To be fair, we will use the same number of points for each example.
NLAT = 50
NLON = 100
rect = RectangularGrid(nlat=NLAT, nlon=NLON)
spiral = SpiralGrid(n_points=NLAT*NLON)

fig, ax  = plt.subplots(1, 2, figsize=(10, 5))

for i, cg in enumerate([rect, spiral]):
    lats, lons = cg.grid()
    ax[i].scatter(lons, lats,s=2,alpha=0.5)
    ax[i].set_xlabel('Longitude')
    ax[i].set_ylabel('Latitude')
    ax[i].set_title(cg.__class__.__name__)
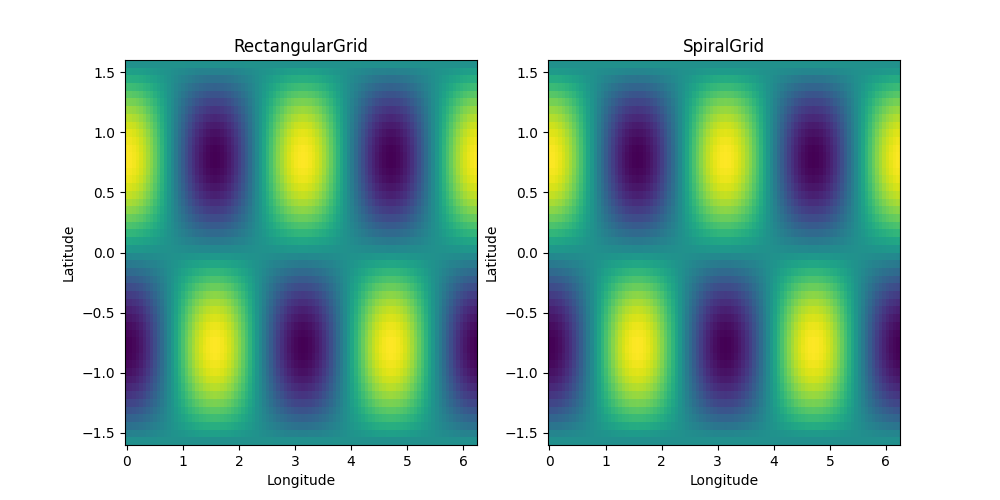
Map the surface
We can create a map based on some data.
fig, ax  = plt.subplots(1, 2, figsize=(10, 5))
for i, cg in enumerate([rect, spiral]):
    lats, lons = cg.grid()
    data = np.sin(2*lats)*np.cos(2*lons)
    llat,llon,resampled_data = cg.display_grid(NLAT, NLON, data)
    ax[i].pcolormesh(llon, llat, resampled_data.T)
    ax[i].set_xlabel('Longitude')
    ax[i].set_ylabel('Latitude')
    ax[i].set_title(cg.__class__.__name__)
Compare resolutions
The rectangular grid’s worst resolution is at the equator. If Nlon = 2*Nlat, then the resolution is 2pi/Nlon radians.
The spiral grid has the same resolution everywhere. It is sqrt(4pi steradians / N)
In this example we will fix the resolution to be 10 degrees.
The rectangular grid requires 648 points.
fig, ax  = plt.subplots(1, 2, figsize=(10, 5))
print(f'The spiral grid requires {n_points} points.')
for i, cg in enumerate([rect, spiral]):
    lats, lons = cg.grid()
    data = np.sin(2*lats)*np.cos(2*lons)
    try:
        llat,llon,resampled_data = cg.display_grid(5*NLAT, 5*NLON, data)
    except TypeError: # Rectangular grids don't support resampling -- there would be little point to it.
        llat,llon,resampled_data = cg.display_grid(NLAT, NLON, data)
    ax[i].pcolormesh(llon, llat, resampled_data.T)
    ax[i].set_xlabel('Longitude')
    ax[i].set_ylabel('Latitude')
    ax[i].set_title(cg.__class__.__name__)
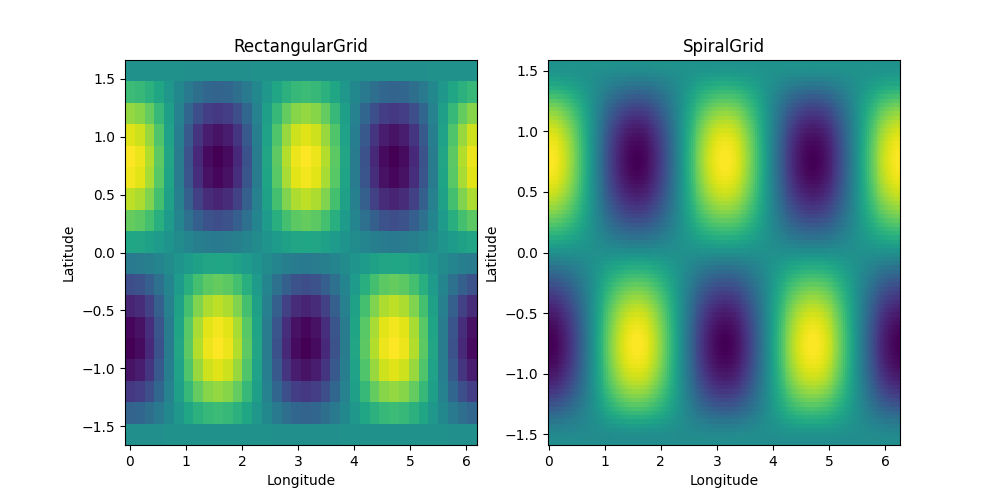
The spiral grid requires 413 points.
Total running time of the script: (0 minutes 4.413 seconds)