Note
Go to the end to download the full example code.
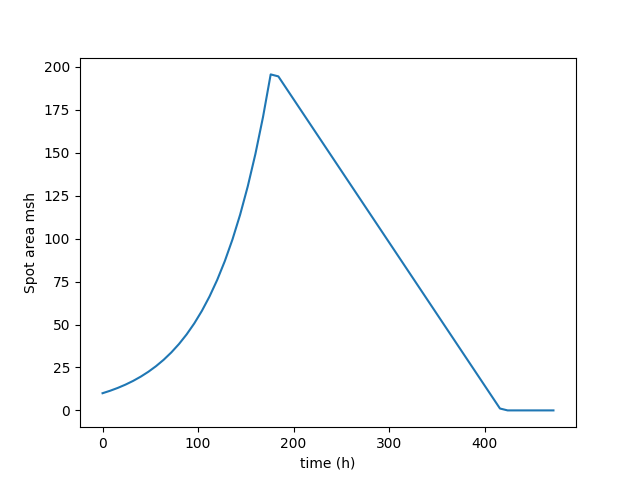
Plot the growth and decay of a spot
This example initializes a StarSpot object and plots it’s
area as a function of time.
from astropy import units as u
import numpy as np
import matplotlib.pyplot as plt

from vspec_vsm.spots import StarSpot, SpotCollection
from vspec_vsm.config import MSH

SEED = 10
rng = np.random.default_rng(SEED)
Initialize the spot
First, let’s initialize a StarSpot object.
We then add it to a SpotCollection object
because it will automatically delete the spot
when it decays.
Note: The most common unit of spot area is the micro solar hemisphere (MSH).
spot = StarSpot(
    lat=0*u.deg,
    lon=0*u.deg,
    area_max=200*MSH,
    area_current=10*MSH,
    teff_umbra=2700*u.K,
    teff_penumbra=2900*u.K,
    area_over_umbra_area=5.,
    is_growing=True,
    growth_rate=0.5/u.day,
    decay_rate=20*MSH/u.day,
    grid_params=1000
)
spotlist = SpotCollection(spot)

print(
    f'The spot starts with an area of {spot.area_current}, and will grow to {spot.area_max}.')
The spot starts with an area of 10.0 msh, and will grow to 200.0 msh.
Step through time
We now will plot the area of the spot as a function of time
dt = 8*u.hr
total_time = 20*u.day
n_steps = int(total_time/dt)
time = np.arange(n_steps)*dt
area = []
area_unit = MSH
for _ in range(n_steps):
    try:
        current_area = spotlist.spots[0].area_current.to_value(area_unit)
    except IndexError:  # the spot has decayed, so `spotlist.spots` is empty
        current_area = 0
    area.append(current_area)
    spotlist.age(dt)
plt.plot(time, area)
plt.xlabel(f'time ({time.unit})')
plt.ylabel(f'Spot area {area_unit}')
Text(38.347222222222214, 0.5, 'Spot area msh')
Total running time of the script: (0 minutes 0.176 seconds)