Note
Go to the end to download the full example code.
Visualize the Spot Generator
This example walks through the SpotGenerator class.
from astropy import units as u
import numpy as np
from cartopy import crs as ccrs
import matplotlib.pyplot as plt


from vspec_vsm.spots import SpotCollection, SpotGenerator
from vspec_vsm.config import MSH

SEED = 10
rng = np.random.default_rng(SEED)
Initialize the Generator
We will use the SpotGenerator class
Generate some spots
The above generator creates spots that do not grow or decay and are spread evenly across the surface.
r_star = 0.15*u.R_sun
teff_star = 3000*u.K
target_coverage = 0.2
spots = mstar_gen.generate_mature_spots(
    coverage=target_coverage,
    r_star=r_star
)
spots = SpotCollection(*spots, gridmaker=mstar_gen.gridmaker)
star_surface_area = 4*np.pi*r_star**2
expected_n_spots = 2*(star_surface_area * target_coverage /
                      mean_spot_area).to_value(u.dimensionless_unscaled)
print(
    f'We have generated {len(spots.spots)} mature spots on the stellar surface. We expected {expected_n_spots:.1f}')
fig, ax = plt.subplots(1, 1)
spot_areas = [spot.area_current.to_value(MSH) for spot in spots.spots]
ax.hist(spot_areas)
ax.set_xlabel('Area (msh)')
ax.set_ylabel('count')

We have generated 35 mature spots on the stellar surface. We expected 36.0

Text(55.847222222222214, 0.5, 'count')
Map the surface
We can create a map of the stellar surface based on the effective temperature.
We can also ask: did we hit our target spot coverage?
fig = plt.figure()
proj = ccrs.Mollweide(central_longitude=0)
ax = fig.add_subplot(projection=proj)

tmap = spots.map_pixels(star_rad=r_star, star_teff=teff_star)
lats, lons = spots.gridmaker.oned()

spotted_fraction = spots.get_coverage(r_star)

im = ax.pcolormesh(
    lons.to_value(u.deg),
    lats.to_value(u.deg),
    tmap.to_value(u.K).T,
    cmap='viridis',
    transform=ccrs.PlateCarree()
)
fig.colorbar(im, ax=ax, label='$T_{eff}$ (K)')
s = f'{spotted_fraction*100:.0f}% of surface covered by spots. Target was {target_coverage*100:.0f}%'
fig.text(0.1, 0.2, s)
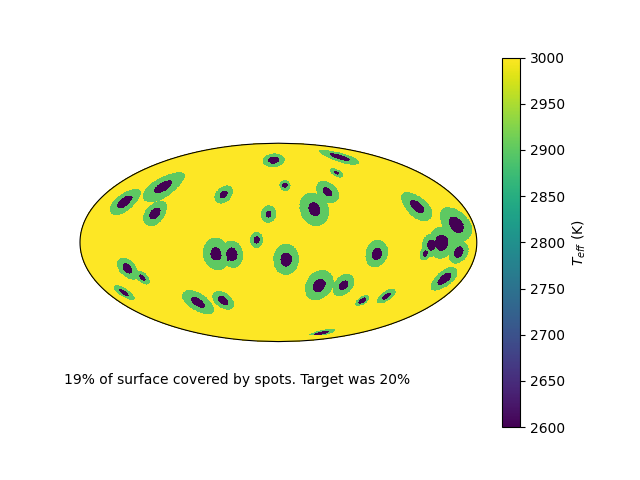
Text(0.1, 0.2, '19% of surface covered by spots. Target was 20%')
The solar case
We can also produce spots with properties much more like those we see on the Sun.
Below we initialize a generator along with a SpotCollection object to hold the generated spots.
mean_spot_area = 100*MSH
target_coverage = 0.1
solar_gen = SpotGenerator(
    dist_area_mean=mean_spot_area,
    dist_area_logsigma=0.2,
    umbra_teff=2600*u.K,
    penumbra_teff=2900*u.K,
    growth_rate=0.5/u.day,
    decay_rate=10*MSH/u.day,
    init_area=10*MSH,
    distribution='solar',
    coverage=target_coverage,
    grid_params=(500, 1000), rng=rng
)
r_star = 0.15*u.R_sun
teff_star = 3000*u.K
spots = SpotCollection(gridmaker=solar_gen.gridmaker)
Spot creation rate
We can specify a time period over which the generator will create new spots. It uses the average spot lifetime to calculate the number of new spots that should be created in a given time.
A Poisson draw is then used to pick a number based on the expectation value.
In 1.0 d we expect 6.3 new spots.
Growth-decay equillibrium
Iterating through time allows us to aproach equillibrium.
n_steps = 50
coverage = [spots.get_coverage(r_star)]
for _ in range(n_steps):
    spots.age(dtime)
    new_spots = solar_gen.birth_spots(dtime, r_star)
    spots.add_spot(new_spots)
    coverage.append(spots.get_coverage(r_star))
time = np.arange(n_steps+1)*dtime
plt.plot(time, coverage)
plt.xlabel(f'time ({time.unit})')
plt.ylabel('Spot coverage fraction')

Text(33.972222222222214, 0.5, 'Spot coverage fraction')
Map of sun-like spots
We can map the surface after the spots have reached equillibrium.
fig = plt.figure()
proj = ccrs.Mollweide(central_longitude=0)
ax = fig.add_subplot(projection=proj)

tmap = spots.map_pixels(star_rad=r_star, star_teff=teff_star)
lats, lons = spots.gridmaker.oned()

spotted_fraction = spots.get_coverage(r_star)

im = ax.pcolormesh(
    lons.to_value(u.deg),
    lats.to_value(u.deg),
    tmap.to_value(u.K).T,
    cmap='viridis',
    transform=ccrs.PlateCarree()
)
fig.colorbar(im, ax=ax, label='$T_{eff}$ (K)')
s = f'{spotted_fraction*100:.0f}% of surface covered by spots. Target was {target_coverage*100:.0f}%'
fig.text(0.1, 0.2, s)

Text(0.1, 0.2, '9% of surface covered by spots. Target was 10%')
Total running time of the script: (1 minutes 19.280 seconds)